max planck institut
informatik
informatik

|
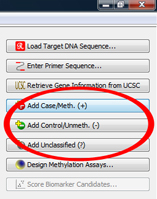
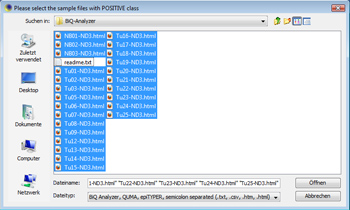
This tutorial shows how to use MethMarker to design new biomarkers. It does not start at the beginning of the workflow but follows tutorial 1. Please go through tutorial 1 for that. Load sample dataClick on "Add Case/Meth. (+)" to load sample data. The demonstration data provides a set of tumor and control samples. Open all Note: Adding all samples via this button suggests that all samples are (methylated) cases. This might not be correct, but in this step, this is insignificant. Later, MethMarker will classify all samples according to their methylation grade. Nevertheless, you can manually add positive and negative samples via these buttons. |
|
|
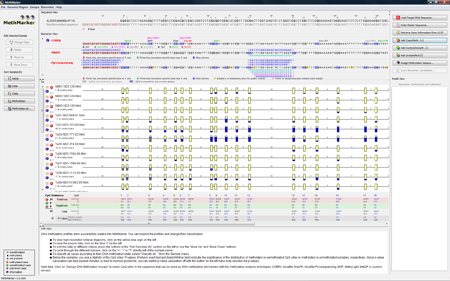
MethMarker aligns all samples against the genomic target region (Needleman-Wunsch alignment), and generates graphical representations of the samples, shown in the "Data View". All samples have a red "plus", since they are all added as cases. Below the samples, a short statistical summary is calculated for the CpG methylation states. Besides simple countings of methylated and unmethylated CpG sites, MethMarker will calculate two p-Values (Fisher's exact test and Mann-Whitney test) to show how significantly the CpG sites are distributed among methylated and unmethylated samples. TIP: You can change a sample's class by clicking on the red "plus" in the sample. TIP: You can see a detailed methylation profile of a sample by clicking on the yellow "plus" in the sample. |
|
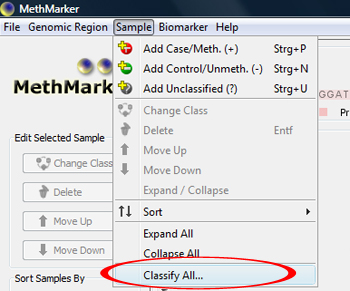
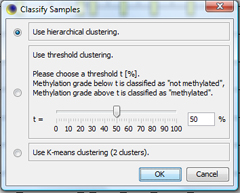
Classify samplesClick on "Classify All..." in the Sample menu to classify all samples according to their methylation average. Choose "Hierarchical clustering" as clustering method. |
|
|
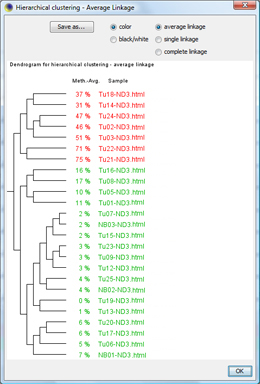
The classification window shows the dendrogram of the classification. You can click OK to apply the sample's classes. TIP: With "Save as...", the dendrogram can be saved as |
|
|
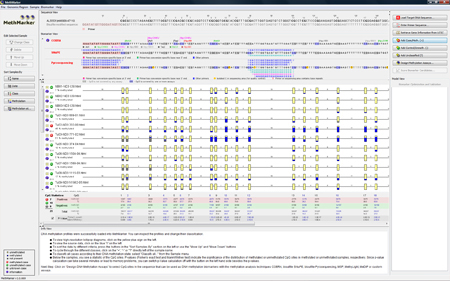
The samples are now classified according to the overall (average) methylation grade. |
|